In 2010, a Nobel Prize-winning study found that earning more money only boosts happiness up to a point; once you hit $75,000, more money doesn’t mean more satisfaction. Fast-forward more than a decade and one world-economy-altering pandemic later, and we wanted to know: is that still true?
To find out, moneyzine.com asked 1,200 Americans not only about their income, but also about how satisfied they are with what they earn and how much more they needed to earn for the work they did to hit that income-happiness sweet spot. And the results…well, they’re a little alarming.
Key takeaways:
Nearly all U.S. residents report needing a salary of $100,000/year to be happy
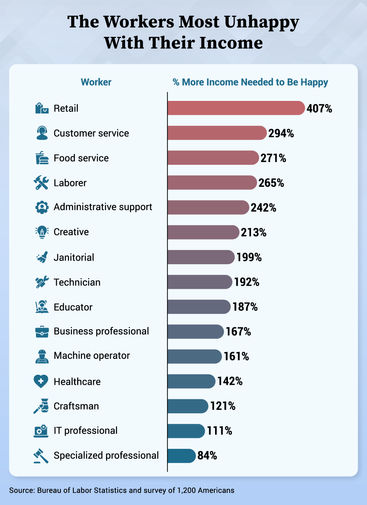
Retail workers need 407% more income to be satisfied
Americans are avoiding vacations (73%), social outings (67%), and more due to financial unrest
Retail Workers Are the Most Dissatisfied
For anyone who has worked in retail, it should come as no surprise that this is the industry with the largest disconnect between actual income and the income workers believe would keep them happy at work.
Get this: the difference for retail employees is just over 400%! That means people working in retail earn a quarter of what they need to be happy. No wonder the employee turnover rate is over 60%...
On the other end of the spectrum, specialized professionals—think doctors, lawyers, or engineers—actually reported they could earn 84% of what they currently do and still be satisfied.
Nearly Everyone Reports Needing $100k/Year to Be Happy
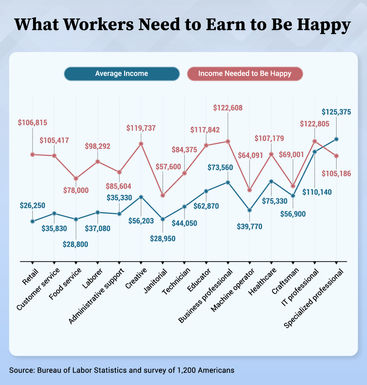
The average income workers across fifteen industries reported they needed to be satisfied with their jobs was $96,303.
From retail workers and customer service representatives to IT professionals and surgeons, $100,000 per year seems to be the magic number.
Just keep in mind that the average income in America is just under a third of that at around $31,000. That means most people earn about a third of what they think they should be paid.
The Elusive Sweet Spot: What Income Is Considered Ideal in Each State?
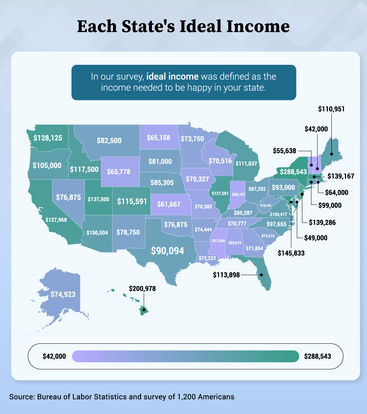
Keeping with the $100k/year income goals across industries, the average income across all 50 states that respondents reported needing to be happy was $94,696, just under $100,000 per year.
Alabama: $69,615
Alaska: $74,923
Arizona: $100,504
Arkansas: $74,444
California: $127,968
Colorado: $115,591
Connecticut: $99,000
Delaware: $49,000
Florida: $113,898
Georgia: $71,854
Hawaii: $200,978
Idaho: $117,500
Illinois: $127,581
Indiana: $58,167
Iowa: $70,327
Kansas: $61,667
Kentucky: $85,287
Louisiana: $72,222
Maine: $110,951
Maryland: $145,833
Massachusetts: $139,167
Michigan: $111,037
Minnesota: $73,750
Mississippi: $57,500
Missouri: $70,385
Montana: $82,500
Nebraska: $85,305
Nevada: $76,875
New Hampshire: $42,000
New Jersey: $139,286
New Mexico: $78,750
New York: $288,543
North Carolina: $97,655
North Dakota: $65,158
Ohio: $87,292
Oklahoma: $76,875
Oregon: $105,000
Pennsylvania: $93,000
Rhode Island: $64,000
South Carolina: $81,000
South Dakota: $75,215
Tennessee: $70,777
Texas: $90,094
Utah: $137,500
Vermont: $55,638
Virginia: $100,417
Washington: $128,125
West Virginia: $78,342
Wisconsin: $70,516
Wyoming: $65,778
Interestingly, the reported necessary income to be happy and satisfied isn’t directly correlated with the local cost of living. Hawaii and New York—two of the most expensive states—also had the highest desired incomes and were the only two states needing over $200,000.
However, California and Massachusetts—both of which have higher costs of living than NY—came in just a little over average at $130,000 desired per year.
Delaware and New Hampshire were the two least needy states, both with incomes below $50,000 being required for workers to be satisfied with their paychecks.
The Salary Struggle: Which States Are the Least Satisfied With Their Income?
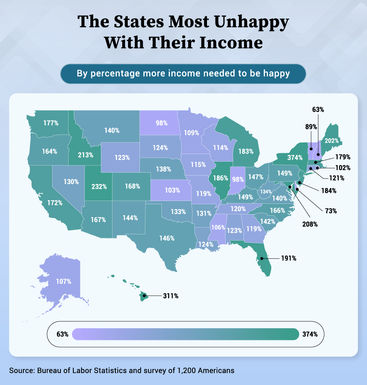
With those $200,000+ annual income goals, it’s no surprise that New Yorkers and Hawaiians reported the largest discrepancies between actual income and reported yearly pay to be satisfied. In both states, workers require an average of over 300% more per year to be happy.
Alabama: 123%
Alaska: 107%
Arizona: 167%
Arkansas: 131%
California: 172%
Colorado: 168%
Connecticut: 121%
Delaware: 73%
Florida: 191%
Georgia: 119%
Hawaii: 311%
Idaho: 213%
Illinois: 186%
Indiana: 98%
Iowa: 115%
Kansas: 103%
Kentucky: 149%
Louisiana: 124%
Maine: 202%
Maryland: 208%
Massachusetts: 179%
Michigan: 183%
Minnesota: 109%
Mississippi: 106%
Missouri: 119%
Montana: 140%
Nebraska: 138%
Nevada: 130%
New Hampshire: 63%
New Jersey: 184%
New Mexico: 144%
New York: 374%
North Carolina: 166%
North Dakota: 98%
Ohio: 147%
Oklahoma: 133%
Oregon: 164%
Pennsylvania: 149%
Rhode Island: 102%
South Carolina: 142%
South Dakota: 124%
Tennessee: 120%
Texas: 146%
Utah: 232%
Vermont: 89%
Virginia: 140%
Washington: 177%
West Virginia: 134%
Wisconsin: 114%
Wyoming: 123%
Five states in total are fully satisfied with what they currently earn, and they actually report that they could earn less and still be happy:
Delaware
Indiana
New Hampshire
North Dakota
Vermont
Based on all of this data, the average American requires 150% of their current income in order to be content with their annual salary…a pretty staggering statistic, if you ask us.
What Americans Give Up to Improve Their Financial Situation
More than two-thirds of Americans skip social outings in an effort to save money and improve their lot in life. And things only get more depressing when you ask what else U.S. residents are abstaining from…
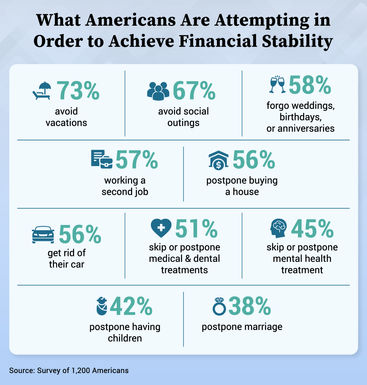
Nearly three-quarters of all workers in the U.S. skip vacations to save, 58% miss important events with family and friends—like birthdays and weddings—and 45% forgo seeking needed mental health treatment.
So…not only is the income in most states not good enough for most to consider themselves “happy,” but a huge subsection of the population is actively sacrificing social and physical health to get more out of the money they do earn.
More Money, More Problems?
It’s pretty clear that this saying doesn’t ring true for most Americans. The average U.S. resident must earn more than twice as much as they currently earn to be happy with their income. Even more disconcerting is that most U.S. workers are willing to make massive sacrifices in other areas of their lives to make their paychecks go further.
Methodology
We surveyed 1,200 people across America about what income they would need to be satisfied and the things they sacrifice to make their money go further. The average age of respondents was 40 years old. 61% of the participants were male, 36% were female, and 3% identified as non-binary or other.
We also used publicly available wage data from the Bureau of Labor Statistics to make comparisons between desired income and actual income across 15 different industries.
Fair Use
Interested in using our data or infographics? Feel free! Please just link back to this page to credit moneyzine.com.
Contributors


