Stashing money away for emergencies or future spending is always a great idea. But do the numbers reflect this wisdom when we look into the actual stats?
Savings Definition
What are savings really? How is it defined? Saving is income not spent—deferred consumption if you will. Methods of savings include putting money aside into, for example, a savings deposit account, an investment fund, a pension account, or as cash.
Saving could also be a reduction in expenditures, such as recurring costs. Or, as the Oxford dictionary puts it: “The money one has saved, especially through a bank or investment plan.” Now, any definition should be expanded to include:
Health Savings Accounts (HSAs)
529 savings accounts for college
Retirement and 401k savings accounts
Digital Wallets
Cryptocurrency accounts
Consumer Spending in the United States
Personal income is up. The cost of goods and services is up more. How does this reflect in the consumer spending of Americans?
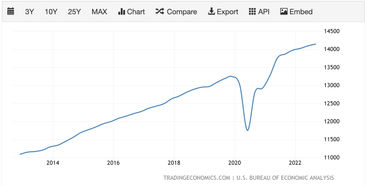
Consumer spending in the United States has increased from $14 trillion (annualized) in Q1 2022 to $14.1 trillion in Q2 2022. Not a stark difference, but it shows that Americans are continuing the trajectory of spending more. (Trading Economics)
Spending as a nation is up 28% over the last 10 years (Trading Economics)
Spending was $13.5 trillion per year in early 2020. Because of Covid-19 and the brief recession, spending pulled back to $11.8 trillion annually. Consumer spending quickly bounced back, however. Today, the upward trend is back on track and very close to the growth rate of pre-pandemic levels. (Trading Economics)
Consumer Confidence in the United States
Personal income is climbing slowly. Expenses are growing rapidly. But, organic spend is still rising. How is consumer confidence? Not surprisingly, it’s at its lowest rate in over 40 years.
June 2022 saw the lowest consumer confidence (50) since 1980, when inflation was upwards of 14%. The all-time high was 111.4 points in January of 2000. (Trading Economics)
Savings Account Statistics
How much does the average American have in savings? Bring on the stats.
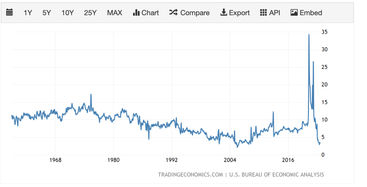
Personal savings as a percentage of disposable (after-tax) income was 3.4% (Sept 2022) (BEA.gov)
As you can see in the below chart and table, this is one of the lowest personal savings rates recorded in American history. In contrast, savings as a percentage of disposable income in 2020 was 17.0%, and in 2021 was 12.0%.
YEAR | PERSONAL SAVINGS (%) |
1929 | 4.7 |
1930 | 4.5 |
1931 | 4.4 |
1932 | -0.2 |
1933 | -0.7 |
1934 | 1.7 |
1935 | 5.1 |
1936 | 7.1 |
1937 | 6.7 |
1938 | 2.9 |
1939 | 5.4 |
1940 | 6.8 |
1941 | 13.9 |
1942 | 26.2 |
1943 | 27.7 |
1944 | 27.9 |
1945 | 22.5 |
1946 | 11.8 |
1947 | 6.3 |
1948 | 8.8 |
1949 | 7 |
1950 | 9.3 |
1951 | 10.9 |
1952 | 11.1 |
1953 | 11 |
1954 | 10.3 |
1955 | 9.7 |
1956 | 11.1 |
1957 | 11.2 |
1958 | 11.4 |
1959 | 10.3 |
1960 | 10.1 |
1961 | 11.3 |
1962 | 11.2 |
1963 | 10.7 |
1964 | 11.6 |
1965 | 11.5 |
1966 | 11.2 |
1967 | 12.3 |
1968 | 11.3 |
1969 | 10.9 |
1970 | 12.8 |
1971 | 13.5 |
1972 | 12.4 |
1973 | 13.5 |
1974 | 13.3 |
1975 | 13.4 |
1976 | 11.6 |
1977 | 10.7 |
1978 | 10.7 |
1979 | 10.3 |
1980 | 11.1 |
1981 | 11.8 |
1982 | 12 |
1983 | 10 |
1984 | 11.3 |
1985 | 9.2 |
1986 | 8.8 |
1987 | 7.9 |
1988 | 8.5 |
1989 | 8.4 |
1990 | 8.4 |
1991 | 8.8 |
1992 | 9.4 |
1993 | 7.9 |
1994 | 6.9 |
1995 | 7 |
1996 | 6.5 |
1997 | 6.3 |
1998 | 6.8 |
1999 | 5 |
2000 | 4.7 |
2001 | 4.9 |
2002 | 5.7 |
2003 | 5.4 |
2004 | 5 |
2005 | 2.9 |
2006 | 3.6 |
2007 | 3.3 |
2008 | 4.6 |
2009 | 5.9 |
2010 | 6.2 |
2011 | 6.8 |
2012 | 8.6 |
2013 | 6.1 |
2014 | 7.1 |
2015 | 7.5 |
2016 | 7 |
2017 | 7.3 |
2018 | 7.6 |
2019 | 8.8 |
2020 | 17 |
2021 | 12 |
Aug 2022 | 3.4 |
Believe it or not, 13% of the population has no emergency savings (Inside 1031)
Roughly 42.6% of Americans have more than $1,000 in their savings account (Inside 1031)
57.4% of Americans have less than $1,000 in savings (which is actually an improvement from 69% back in December 2019)
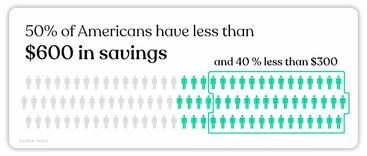
50% of Americans have less than $600 in savings
40% of Americans have less than $300 in savings
The number of Americans living paycheck-to-paycheck is 37.5% (Inside 1031)
The total personal savings amount in America is $652.8 billion (Aug 2022) (BEA.gov)
So how much does the average American have in savings?
The average savings account balance per person is $3,123 (BEA.gov)
The median bank account balance in the United States is $5,300 (Federal Reserve)
The average American savings in the United States is $41,600 (Federal Reserve)
Savings statistics by gender
Who is doing best in the category of savings? Men or women?
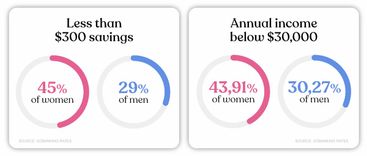
Approximately 45% of women have less than $300 in savings vs. just 29% of men (GOBankingRates)
The gender gap in savings is likely due to the gender gap in income.
While 43.91% of women reported an annual income below $30,000, only 30.27% of men reported an income that low (GOBankingRates)
Savings account stats by age
Overall, the savings percentages don’t look great, but what about the average savings of Americans by age? Is one age group doing far better than another?
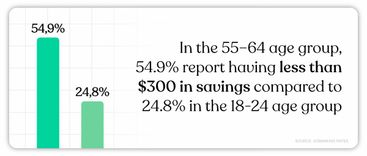
In the 55–64 age group, 54.9% report having less than $300 in savings (GOBankingRates)
In the 18–24 age group, just 24.8% report having less than $300 in savings (GOBankingRates)
Average savings by age
After reviewing all these savings stats, are you asking yourself, “How much should I have saved?” Below are the median and the average savings by age group. How do you compare?
The lowest median savings was $3,240 in the “Under 35” age group (Federal Reserve)
The highest median savings was $6,400 for the age group 55–64 years old (Federal Reserve)
It’s really no surprise that those under 35 years old have the lowest median savings at $3,240. They simply haven’t had the time to stash money away. And those that are 55–64 years old have the largest median savings at $6,400 because they’ve had way more working years to put their money away. See the full table below.
AGE | AVERAGE SAVINGS | MEDIAN SAVINGS |
Under 35 | $11,200 | $3,240 |
35–44 | $27,900 | $4,710 |
45–54 | $48,200 | $5,620 |
55–64 | $57,800 | $6,400 |
Savings rates by country
Which is the top saving country today? Who stashes away the highest percentage of their income into savings?
The country with the top savings rate is Japan, with a rate of 37.7% (Trading Economics)
Other top saving countries are South Korea (35.7%), Mexico (21.6%), Denmark (21.2%), and Sweden (19.8%). The United States nearly came in last with a 3.4% savings rate, but Portugal won that prize with a -2.2% savings rate, which means they’re spending more than they’re earning.
COUNTRY | PERCENT RATE (%) | DATE |
Japan | 37.7 | Aug/22 |
South Korea | 35.7 | Jun/22 |
Mexico | 21.6 | Dec/21 |
Denmark | 21.24 | Jun/22 |
Sweden | 19.78 | Jun/22 |
Ireland | 19.1 | Jun/22 |
Czech Republic | 18.89 | Mar/22 |
Sri Lanka | 18.7 | Dec/21 |
Belgium | 16.9 | Jun/22 |
France | 16.73 | Jun/22 |
Euro Area | 15.2 | Jun/22 |
Netherlands | 15.12 | Jun/22 |
Hungary | 14.83 | Dec/20 |
European Union | 14.59 | Jun/22 |
Austria | 13.83 | Jun/22 |
Luxembourg | 13.73 | Jan/20 |
Switzerland | 12.8 | Dec/20 |
Estonia | 12.7 | Dec/20 |
Italy | 12.6 | Jun/22 |
Norway | 11.6 | Jun/22 |
Slovenia | 11.4 | Jun/22 |
Germany | 11.4 | Jun/22 |
Australia | 11.4 | Jun/22 |
Thailand | 10 | Dec/20 |
Latvia | 8.89 | Dec/20 |
Canada | 8.1 | Jun/22 |
Poland | 7.92 | Mar/22 |
United Kingdom | 6.6 | Jun/22 |
Cyprus | 5.6 | Dec/20 |
Lithuania | 3.48 | Dec/20 |
United States | 3.4 | Sep/22 |
South Africa | 0.3 | Jun/22 |
Finland | 0 | Mar/22 |
Hong Kong | 0 | Sep/22 |
Spain | -0.79 | Jun/22 |
Portugal | -2.23 | Jun/22 |
How much should I have in savings?
Most Americans have less than $1,000 in their savings accounts. Should you have more than that? Absolutely!So, how much cash should you have on hand?Most personal finance experts believe you should have 3–6 months’ worth of expenses in a savings account for emergencies. Let’s say a family spends an average of $50,000 a year. To protect themselves against hard times, they should have between $12,500 and $25,000 (3–6 months of funds) in savings.
Average Savings Account Interest
Ever wonder about your savings account interest rates? Are they any good? Or are you earning far less than the average?
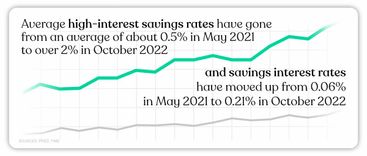
Average savings interest rates have moved up from 0.06% in May 2021 to 0.21% in October 2022 (FRED)
High-Interest savings rates have gone from an average of about 0.5% in May 2021 to over 2% in October 2022. Experts estimate an average of 3% by the end of 2022. (Time)
Checking Account Statistics
Overall, the savings account balances in the US are alarmingly low. Are people using their checking accounts instead? Maybe that’s where all their money is. Let’s see what the stats say about American checking accounts.
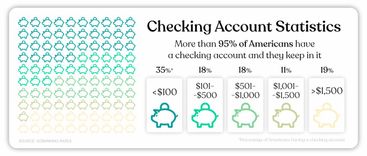
More than 95% of Americans have a checking account (GOBankingRates)
A recent study found that 35% of the US keep less than $100 in their checking accounts (GOBankingRates)
Approximately 18% have checking account balances of $101–$500 (GOBankingRates)
Another 18% have between $501 and $1,000 in their checking account (GOBankingRates)
For 11% of respondents, they like to keep between $1,001 and $1,500 in checking (GOBankingRates)
Only 19% have more than $1,500 in their checking accounts (GOBankingRates)
The median checking account balance in the US is $2,900 (Federal Reserve)
The average checking account balance in the US is $9,132 (Federal Reserve)
Some experts believe the low checking account balances may be due to the low interest offered on most checking accounts. People may have money stashed elsewhere (though based on the savings stats above, we already know the money isn’t in their savings accounts!).
How much money should I keep in my checking account?
The majority of Americans have less than $500 in their checking account. This amount is fine if you have a beefed-up savings account, but personally, I enjoy having a large checking account. Why? Some credit unionsoffer 3% intereston your checking account balance up to $15,000. In other words, you could earn $450 a year for doing absolutely nothing. Not a bad deal! It’s a great reason to park some money in your checking account.
Retirement Savings Statistics
We already discovered that Americans only have a median savings account balance of $5,300 and a median checking account balance of $2,900. Perhaps people don’t like parking their money into low-interest accounts. Naturally then, we should see a hefty amount in investment accounts, right? Spoiler alert. This isn’t the case.
A recent survey found that 63% of Americans have less than $50,000 saved for retirement (GOBankingRates)
Perhaps more shockingly, 37% had less than $10,000 saved for retirement (GoBankingRates)
Average savings by age—retirement savings
When people ask, “How much does the average American have in savings?” they’re usually referring to the average American retirement savings. Below, you’ll find the retirement savings statistics by age from Personal Capital as of September 2021. How does your retirement balance compare vs. these 401k savings statistics? Are you ahead of the curve? Or behind?
The average retirement balance for Gen Z is $38,633 (Personal Capital)
Millennials average $178,741 in their retirement account (Personal Capital)
Retirement accounts owned by Gen X individuals average $605,526 (Personal Capital)
Baby Boomers average $1,076,208 in their retirement accounts (Personal Capital)
Average retirement savings in the US: $65,000 (Federal Reserve)
How many people have $1,000,000 in savings?
Were you surprised to see the $1M average retirement account for the baby boomers above? It may have led you to ask what percentage of people have 1 million dollars in savings.
Approximately 13% of households have $1,000,000 in their retirement savings (Zippia)
Roughly 10% of individuals have $1,000,000 in their retirement savings account (Zippia)
Median savings by age—retirement savings
Above are theaverageretirement savings by age group, but some individuals skew the results with extremely high savings totals. So what about the median savings by age (ie. the true mid-point)? What does that tell us about the typical retirement savings amounts by generation? And how do you compare vs. these results?
Gen Z has a median retirement savings of $12,016 (Personal Capital)
The millennial generation has a median retirement savings of $75,745 (Personal Capital)
The middle-age Gen-Xers have a median retirement savings of $303,663 (Personal Capital)
Boomers have a median retirement total of 587,943 (Personal Capital)
These US retirement savings statistics are summed up in the table below.
AGE GROUP | TOTAL USERS | AVERAGE RETIREMENT | MEDIAN RETIREMENT |
Gen Z | 121,489 | $38,633 | $12,016 |
Millennials | 742,108 | $178,741 | $75,745 |
Gen X | 375,718 | $605,526 | $303,663 |
Baby Boomers | 191,648 | $1,076,208 | $587,943 |
Other/No Age Data | 304,134 | $288,592 | $64,828 |
Retirement savings by age—additional stats
For ages 18 to 24, 36% reported retirement savings of less than $10,000 (GOBankingRates)
For ages 25 to 34, 38% reported retirement savings of less than $10,000 (GOBankingRates)
For ages 35 to 44, 37% reported retirement savings of less than $10,000 (GOBankingRates)
For ages 45 to 54, 35% reported retirement savings of less than $10,000 (GOBankingRates)
For ages 55 to 64, 37% reported retirement savings of less than $10,000 (GOBankingRates)
And even 31% of folks older than 65 reported retirement savings of less than $10,000 (GOBankingRates)
AGE 18–24 | AGE 25–34 | AGE 35–44 | AGE 45–54 | AGE 55–64 | AGE 65+ | |
% with less than $10k in retirement | 36% | 38% | 37% | 35% | 37% | 31% |
These retirement savings stats tell us that either you start saving for your retirement early or you never do it (or perhaps you finally get around to it in your early 60s, which is too late!). It’s best to just start early and get it out of the way. We all know we should anyway!
For those aged 65 or older, 12% had retirement savings of over $750,000 (compared to just 4% of the general population) (GOBankingRates)
US retirement savings statistics by state
How well do some states save for retirement vs. others? Is there really a stark difference? And how well are you saving for retirement vs. others in your state? Take a look! (provided by Personal Capital)
STATE | AVERAGE RETIREMENT BALANCE | RANK |
AK | $503,822 | 4 |
AL | $395,563 | 36 |
AR | $364,395 | 46 |
AZ | $427,418 | 31 |
CA | $452,135 | 17 |
CO | $449,719 | 19 |
CT | $545,754 | 1 |
DC | $347,582 | 49 |
DE | $454,679 | 14 |
FL | $428,997 | 28 |
GA | $435,254 | 26 |
HI | $366,776 | 45 |
IA | $465,127 | 11 |
ID | $437,396 | 25 |
IL | $449,983 | 18 |
IN | $405,732 | 33 |
KS | $452,703 | 15 |
KY | $441,757 | 23 |
LA | $386,908 | 39 |
MA | $478,947 | 8 |
MD | $485,501 | 7 |
ME | $403,751 | 35 |
MI | $439,568 | 24 |
MN | $470,549 | 9 |
MO | $410,656 | 32 |
MS | $347,884 | 48 |
MT | $390,768 | 38 |
NC | $464,104 | 12 |
ND | $319,609 | 50 |
NE | $404,650 | 34 |
NH | $512,781 | 3 |
NJ | $514,245 | 2 |
NM | $428,041 | 29 |
NV | $379,728 | 42 |
NY | $382,027 | 40 |
OH | $427,462 | 30 |
OK | $361,366 | 47 |
OR | $452,558 | 16 |
PA | $462,075 | 13 |
RI | $392,622 | 37 |
SC | $449,486 | 21 |
SD | $449,628 | 20 |
TN | $376,476 | 43 |
TX | $434,328 | 27 |
UT | $315,160 | 51 |
VA | $492,965 | 6 |
VT | $494,569 | 5 |
WA | $469,987 | 10 |
WI | $448,975 | 22 |
WV | $370,532 | 44 |
WY | $381,133 | 41 |
The top 5 states for average retirement savings are Connecticut, New Jersey, New Hampshire, Alaska, and Vermont. Connecticut secured the top spot with $545,754 in average retirement savings. (Personal Capital)
Based on the numbers, 4 out of the top 5 states are located on the East Coast. There is no definitive reason for this, but some of the highest earners in the nation gravitate toward the expensive luxurious homes on the East Coast. Plus, the tax laws in CT, NJ, NH, and VT are more favorable when compared to, say, California on the West Coast.
The states that land in the bottom 5 for average retirement savings are Utah, North Dakota, District of Columbia, Oklahoma, and Mississippi. The state with the lowest average retirement savings is Utah, with $315,160. (Personal Capital)
What percentage of your income should you save?
We’ve gone through percentages and dollars for what everyone else has, but what about you? How much should you actually be putting toward your retirement savings? Many experts say you should put 10% of your income toward retirement. More traditional advisors recommend 15%. But, if you start saving late in life (after 35 years old), you’ll likely want to increase your retirement contributions to nearly 20% or more if possible.
Health Savings Account Statistics (HSA Savings Statistics)
A health savings account is a fantastic way to save money toward future medical expenses. You can put pre-tax earnings into the account (so no income tax is owed). At a certain minimum threshold (typically $1,000), you can invest your savings and earn money. And, as long as you use the funds for medical purposes, you can withdraw the funds tax-free as well!So how well are people capitalizing on the Health Savings Accounts?
The average holder has a total HSA balance of $19,224 in their account (Devenir)
In total, there are over 32 million health savings accounts in the US (Devenir)
During 2021, HSA assets grew to $98 billion, an increase of 19% from the prior year (Devenir)
HSA investment assets grew to an estimated $34.4 billion, up 45% year-over-year (Devenir)
Account holders contributed over $42 billion and withdrew almost $31 billion from their accounts in 2021 (Devenir)
Participation in HSA investing is increasing. Over 2 million accounts (7% of the approx. total of 32 million) have at least a portion of their HSA dollars invested. (Devenir)
529 Savings Statistics
Yet another type of savings account is the529 account, a fund specifically for future college expenses. Post-tax dollars are invested into these accounts, but when withdrawn and used for college expenses (tuition, housing, books, etc.), no tax dollars are owed on the gains.
The combined assets of all Section 529 plans were $480.4 billion at the end of 2021, an increase of 13.0% since the end of 2020 (Investment Company Institute)
Of the $480.4 billion in 529 funds, $452.6 billion were invested in savings plans, while $27.8 billion were within pre-paid plans.
As of 2021, there were 15.7 million accounts, an increase of 5.7% from 2020 (Investment Company Institute)
Of the 15.7 million accounts, 14.8 million are in saving plan accounts, and 0.9 million are in prepaid accounts.
Digital Banking and Wallet Saving Statistics
Common digital wallet accounts in the U.S. are Apple Pay and Google Pay. These wallets hold debit card and credit card information so you can make payments seamlessly via your phone instead of with plastic cards. Other types of digital wallets are PayPal and Venmo, where you can house money just like an online savings account.
The average Paypal user has $485 in their account (Logica)
By the end of 2021, there were almost 2.7 billion users of digital banking globally, driven by the rise of digital-only banks and the ongoing focus on digital transformation by established bank brands. (Juniper Research)
Between 2020 and 2024, the digital banking user base is expected to grow by 50% globally (Juniper Research)
The number of people using digital wallets is expected to reach 4.4 billion by 2025, with QR codes accounting for 40% of all digital wallet transactions. (Juniper Research)
The top mobile payment platforms are Alipay (650 million users), WeChat Pay (550 million users), Apple Pay (507 million users), Google Pay (421 million users), and PayPal (377 million users). (Merchant Machine)
DIGITAL WALLET | USERS IN MILLIONS |
Alipay | 650 |
WeChat Pay | 550 |
Apple Pay | 507 |
Google pay | 421 |
PayPal | 377 |
Paytm | 333 |
PhonePe | 300 |
Samsung Pay | 140 |
Venmo | 52 |
Cash App | 36 |
At the point of sale, 25.7% of customers worldwide used mobile wallets in 2020. Usage of mobile wallets is expected to jump to 33.4% by 2024. (Merchant Machine)
Credit card and debit card usage at point of sale is 22.4% and 22.3%, respectively. This usage is expected to remain stable through 2024. (Merchant Machine)
PAYMENT METHOD | 2020 | 2024 (ESTIMATE) |
Digital/Mobile Wallet | 25.70% | 33.40% |
Credit Card | 22.40% | 22.80% |
Debit Card | 22.30% | 22.40% |
Cash | 20.50% | 12.70% |
POS Financing | 3.50% | 3.30% |
Prepaid Card | 3.40% | 3.20% |
Charge Card | 2.20% | 2.30% |
As of 2021, it is estimated that 87.3% of Chinese citizens have adopted mobile wallets (Merchant Machine)
Behind China, the next closest digital wallet adoption is Denmark, with a 40.9% adoption rate. The main reason for China’s high adoption rate is that Alipay worked seamlessly with Alibaba, one of the world’s largest online retailers. (Focus Finance)
COUNTRY | 2019 | 2021 |
China | 81.1 | 87.3 |
Denmark | 40.9 | - |
India | 37.6 | 40.1 |
South Korea | 36.7 | 45.6 |
Sweden | 36.2 | - |
United States | 29 | 43.2 |
Canada | 26 | 29.1 |
Norway | 25.8 | - |
Japan | 25.3 | 34.9 |
Switzerland | 22.3 | - |
Italy | 21.1 | 25.9 |
Indonesia | 19.8 | 24.6 |
Netherlands | 19.7 | - |
United Kingdom | 19.1 | 24.4 |
Australia | 18.8 | - |
Finland | 17.9 | - |
Russia | 17.2 | 21.1 |
Spain | 16.5 | - |
France | 15.6 | 21.1 |
Argentina | 14.5 | - |
Brazil | 14.5 | 20.7 |
Germany | 12.5 | 19 |
Mexico | 10.2 | 14.2 |
The average transaction value of a digital wallet transaction in the U.S. is 25% higher than a typical card transaction (Worldpay)
Globally, more than half of all e-commerce transactions are expected to be made with a digital wallet by 2023 (Worldpay)
Cryptocurrency Statistics
Crypto is a digital currency in a decentralized system using cryptography rather than a centralized authority (like the banking system). This is yet another area where people might be stashing their savings. How many people hold crypto? And how much of their savings is here?
Approximately 23% of Americans use cryptocurrency (Finder)
Americans with crypto have an average $1,003 in crypto. But the median amount of crypto in American digital wallets is just $191. (Finder)
The top cryptocurrency (by market capitalization) is Bitcoin (BTC). Other popular crypto options are below. (Statista)
Ethereum (ETH)
Tether (stablecoin)
USDCoin (stablecoin known best as USDC)
Binance (BNB)
Ripple (XRP)
Binance USD (BUSD)
Cardano (ADA)
Solana (SOL)
Dogecoin (DOGE)
Over 21,427 cryptocurrencies are in circulation (Statista)
Men own cryptocurrency at more than twice the rate of women, with 32% of men surveyed saying they own a type of cryptocurrency versus just 15% of women (Finder)
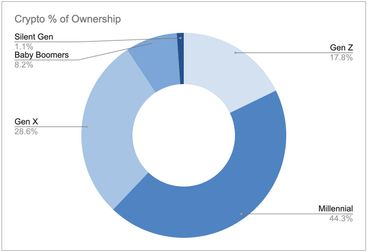
Millennials own the most crypto. Of all cryptocurrency investors, 44.3% are millennials, followed by 28.6% of Gen X, and 17.8% of gen Z. Baby boomers accounted for only 8.2% of all cryptocurrency investors (Finder)
67% of Millennials Look to Bitcoin as a Safe Haven Asset as Compared to Gold (Bitcoin)
Overall, 86% of Americans say they have heard at least a little about cryptocurrencies, including 24% who say they have heard a lot about them, according to the survey of U.S. adults. (Pew Research)
A recent survey shows that 80% of white respondents are more aware of Bitcoin, compared to 66% for Hispanic, and 61% for Black respondents (Statista)
Almost 70 million people use a blockchain wallet worldwide. About a third of Nigerians use cryptocurrency. (Statista)
Global market size of digital payments surpassed 700 billion transactions in 2020, representing 14% growth over the prior year. (Consultancy)
Global mining income is $20,180,061,869 per year (Digiconomist)
Globally, crypto miners use 121.36 terawatt hours (TWh) of energy per year to run their computers, amounting to more electricity usage than the entire country of Argentina (BBC)
Credit Card Debt Statistics in America
So far, we have covered personal income, the cost of goods and services, and nearly all types of savings. What’s left? Anti-savings—i.e., debt. More specifically, credit card debt.
The average credit card debt of Americans in 2022 is $5,221 (Experian)
Approximately 44% of Americans Would Use Credit Cards To Cover a $2,000 Emergency (Inside 1031)
And, 45% of Americans wouldn’t pursue a relationship with someone with significant credit card debt—particularly boomers, with 71% saying credit card debt would be a deal-breaker (Inside 1031)
More than half of Americans (55%) carry a credit card balance from month to month (Inside 1031)
Nearly 1 in 5 Americans (18%) have more than $20,000 in credit card debt (Inside 1031)
A recent survey found that 30% of Americans have between $1,001 and $5,000 in credit card debt (GOBankingRates)
Approximately 39% of Americans believe they will be able to pay off all of their credit card debt at some point in the next year (GOBankingRates)
Roughly 33% of Americans believe it will take over 2 years to pay off their credit card debt (GOBankingRates)
Of all the generations, Gen Xers are the most likely (32%) to owe more than $15,000 on their credit cards (Inside 1031)
More than half of Americans (57%) have missed at least one credit card payment, with 31% most recently missing a payment in 2021 and 28% most recently missing a payment in 2020 (Inside 1031)
49% of Americans depend on credit cards to cover essential living expenses. This is more common among younger generations: 61% of Gen Zers and 53% of millennials use credit cards for living expenses. Conversely, only 26% of boomers rely on credit cards to cover essential expenses. (Inside 1031)
Spontaneous Spending in America
Nearly three in four (73%) respondents said most of their purchases are spontaneous—a large jump from 59% who held the same sentiment last year. (Slickdeals)
Sixty-four percent of U.S. adults report an increase in their impulse spending in 2022 (Slickdeals)
According to this year's survey, the average person spends $314 per month on impulse purchases, up from $276 in 2021 and $183 in 2020 (PR Newswire)
The most common unplanned purchases in 2022 include clothing (35%), food and groceries (30%), household items (29%), shoes (28%), and consumer technology (27%) (PR Newswire)
How Much Money Does the Average American Have?
After walking through the 100+ savings statistics above, what can we say about the savings of the average American? How much do they actually have?
Average savings account: $41,600
Average checking account: $9,132
Average retirement account: $65,000
Average digital wallet amount: $485
Average crypto holdings: $191
Average credit card debt: -$5,221
Total Average Savings in America: $111,187
In total, the average American has $111,187 saved up. It’s not nothing, but it’s not enough to live on for any extended period of time. The average person is halfway through their life. Most are targeting a $1 million dollar nest egg for retirement. If that’s the goal, the average savings should be at least $300,000, if not more.


.jpg)
.jpg)

