The balance sheet provides investors with a summary of a company's financial position at a point in time. This accounting report contains a listing of assets owned and debts owed, thereby allowing the reader to understand the company's worth as well as the money borrowed from lenders and owed creditors.
In this article, we're going to provide a high-level overview of the process required to build a balance sheet. As part of that discussion, we'll first talk about the ways this report is used by financial analysts. Next, we'll walk through the three sections of this financial statement, and talk about the information appearing in each. Then we'll finish up with an example, including a spreadsheet that can be downloaded to illustrate these points.
Balance Sheet Basics
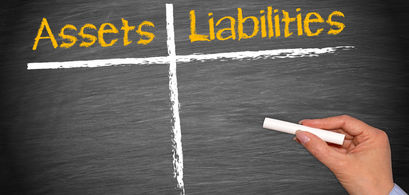
Also known as a net worth statement and a statement of financial position, the purpose of the balance sheet is to provide a report of the company's financial position at a point in time. Structurally, the balance sheet is divided into two sections. Assets tell the analyst how the company has been using its cash, while Liabilities and Owner's Equity provide insights into the sources of capital funding. This is why these two sections are sometimes described as Uses of Cash and Sources of Cash.
As the name implies, the Owes / Owns or Sources / Uses must always be in balance. As cash flows into a company (Liability / Owner's Equity), the company must account for the way it has been used (Assets). The equation used to demonstrate this relationship is as follows:
Assets = Liabilities + Owner's Equity
The balance sheet can also be used by analysts and creditors to determine the net worth of a company. This is sometimes referred to as the company's solvency. This relationship can be expressed using a variation of the above formula:
Owner's Equity (Net Worth) = Assets - Liabilities (or debt)
Liquidity and Solvency
When reading a balance sheet, creditors are focusing on two measures: liquidity and solvency. Liquidity is a measure of a company's ability to pay its debt obligations on time. Solvency is a term used to describe the ability of a company to meet its long-term fixed expenses, long-term expansion plans, and growth goals.
Financial Ratios
Three financial ratios that can help analysts understand a company's liquidity and solvency are the current ratio, quick ratio, and leverage (debt-to-worth).
Current Ratio
Also referred to as the liquidity ratio, the current ratio is a measure of a company's liquidity. It provides creditors with a measure of the company's ability to pay current liabilities with current assets. The calculation of the measure is:
Current Ratio = Current Assets / Current Liabilities
The higher the current ratio, the greater is the company's ability to pay its short-term debt obligations using short-term cash. If the current ratio falls below 1.0, the company might find it difficult to repay all its current liabilities.
Quick Ratio
A second measure of liquidity is the quick ratio. This measure removes some of the slightly less liquid current assets from the current ratio equation. The calculation of the quick ratio is:
Quick Ratio = (Cash + Marketable Securities + Accounts Receivable) / Current Liabilities
The higher the quick ratio, the greater is the company's ability to pay its short-term debt obligations using short-term cash. If the quick ratio falls below 1.0, the company might find it difficult to repay all its current liabilities.
Leverage Ratio
This third balance sheet measure helps analysts understand the solvency of the company. Also known as the debt-to-equity ratio and debt-to-worth ratio, the leverage ratio gives investors and creditors a good indication of the company's debt load relative to its net worth. The leverage ratio is calculated as:
Leverage Ratio = Total Liabilities / Net Worth (or Total Equity)
Leverage ratios will vary by industry. Generally, the ratio should be no higher than 2:1. This allows for liabilities to be twice the shareholder's equity. When the ratio goes above 2:1, the company may have trouble paying creditors, as well as obtaining additional long-term funding.
Assets, Liabilities, and Owner's Equity
Along with the statement of cash flows and income statement, the balance sheet is one of the three most important documents used by investors to understand the financial condition of a company. Structurally, the balance sheet is relatively simple in concept. Every company's balance sheet is comprised of three elements:
Assets: accounting rules allow assets to take two forms: Tangible Assets, which have a physical form, such as a building or a piece of machinery. Intangible Assets, which usually involve a legal right or claim such as a patent.
Liabilities: debts of the company, including long-term debt, notes payable, and accounts payable.
Equity: also referred to as owner's equity and shareholder's equity, these are the resources that have been invested by the owners of the company or the excess earnings retained by the company.
Assets
The assets appearing on a balance sheet are further subdivided into two broad categories: current assets and non-current assets, which are also referred to as fixed assets.
Current Assets
When an asset can be expected to be sold or used up in the near term (usually one year or operating cycle), it is categorized as a current asset. This class of assets includes:
Cash and Cash Equivalents: highly-liquid assets that can be readily converted into cash.
Short-Term Investments: government bonds and marketable securities that mature in less than one year.
Inventories: goods and materials held in stock by a company that are waiting to be sold.
Accounts Receivable: bills that have been sent to customers for goods and / or services that have been rendered, but not yet paid for by the customer.
Prepaid Expenses: cash that has already been paid to vendors that will eventually turn into an expense in the next 12 months.
Non-Current or Fixed Assets
This category of assets is those owned by the company which are not classified as current assets, including:
Plant, Property, and Equipment (PPE): these are physical assets and property that is not easily converted into cash.
Intangible Assets: these are non-physical assets, meaning they cannot be touched or seen, and usually cannot be turned into cash. The most common forms of intangible assets include copyrights, patents, trademarks, and goodwill.
Long-Term Investments: bonds with maturities greater than one year, as well as the holdings of any stocks of other companies. Long-term investments also include special accounts such as pension funds, sinking funds, and land held for speculative purposes.
Liabilities
A company's liabilities are debt obligations arising from transactions that have occurred in the past. The balance sheet subdivides liabilities into two broad categories: current liabilities and non-current liabilities, also known as long-term liabilities.
Current Liabilities
When a debt obligation is expected to be liquidated in the near term (usually one year or operating cycle), it is categorized as a current liability. This class of liabilities includes:
Accounts Payable: these are bills the company has received for goods or services but has not paid for yet.
Short-Term Debt: this is money the company borrowed for a term of 12 months or less.
Non-Current or Long-Term Liabilities
Non-current liabilities represent the money the company owes creditors with a term greater than 12 months. This class of liabilities includes:
Notes Payable: also referred to as promissory notes, these are written promises to pay money owed a creditor under terms that include payment due dates as well as the rate of interest charged on the money borrowed.
Long-Term Debt: this is money a company has borrowed, and is typically obtained through the issuing of bonds, with a repayment date that is frequently in the distant future.
Owner's Equity
Also referred to as shareholder's equity, or simply equity, this is the third major element of the balance sheet. Owner's equity is a liability that resides with the owners of the company. Owner's equity can be further subdivided into two broad categories: Retained Earnings and Treasury Stock.
Retained Earnings
The retained earnings of a company can be thought of as the total profits ever earned, minus all of the money paid to shareholders in the form of dividends. Since the value of retained earnings is cumulative, there can be instances where retained earnings are negative. When that occurs, this account is sometimes renamed as "accumulated deficit" or "retained losses."
Treasury Stock
If stock is issued, then subsequently repurchased by the company, it is held as treasury stock. Companies sometimes repurchase stock when they feel their shares are undervalued by the market.
Balance Sheet Template
Balance sheets, along with income statements, are key reports for the financial community as well as lenders such as banks, investors, and vendors who are considering how much credit to grant the firm.
Summarizing what appears in the above section; if we were to build a very simple balance sheet, it would look like the following:
Sample Balance Sheet
Company XYZ Balance Sheet As of 12/31/20XX
Assets | |
Current Assets | $340,500.00 |
Non-Current or Fixed Assets | $1,050,000.00 |
Intangible Assets | $80,000.00 |
Long-Term Investments | $200,000.00 |
Total Assets | $1,670,500.00 |
Liabilities and Owner's Equity | |
Current Liabilities | $140,500.00 |
Long-Term Liabilities | $1,225,000.00 |
Total Liabilities | $1,365,500.00 |
Owner's Equity | $305,000.00 |
Total Liabilities and Owner's Equity | $1,670,500.00 |
Balance Sheet Example
As promised earlier, we're going to provide a link to a balance sheet template. In this Excel workbook, there is example information that was used throughout this tutorial, including all the necessary calculations.
In addition to the information above, this example worksheet also contains categories such as:
Reserve for Bad Debt: an offset to Accounts Receivable, sometimes referred to as a contra asset. These are amounts owed, but expected to be uncollectible.
Accumulated Depreciation: another contra asset, this is the total depreciation expense claimed on the asset. For example, Equipment minus its Accumulated Depreciation will equal the Net Book Value of the company's Equipment.
This article completes a two part series, which also includes the article analyzing the balance sheet.


