Definition
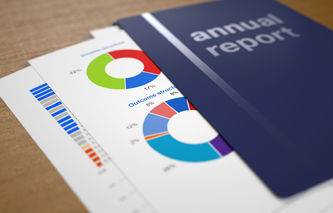
The term financial highlights refers to a section appearing in an annual report that includes a multi-year comparison of operating and business metrics. Financial highlights are oftentimes the first section appearing in an annual report, providing investors with an at-a-glance view of the company's recent performance.
Explanation
Rules under the jurisdiction of the Securities and Exchange Commission require companies to send an annual report to shareholders prior to meetings held to elect members to their Board of Directors. Companies typically combine their annual reports with their Form 10-K and definitive proxy statement and distribute these materials to shareholders approximately forty days prior to these meetings.
The information contained in an annual report is normally audited by the company's accounting firm and includes financial highlights, a Chairperson's Letter as well as the Form 10-K. The financial highlights section of the report usually contains performance over the last several years in addition to the percentage change in each metric over time.
The information in this section can be in the form of a table or graphical displays of the data. The exact information provided may vary between industries, but will usually include the following:
Sales / Revenues
Operating Profit / Net Income / Income from Continuing Operations
Free Cash Flow / Operating Cash Flow
Earnings per Share / Dividends per Share
Return on Equity / Return on Invested Capital / Return on Assets
Total Assets / Total Debt
Example
The following example illustrates how a company's financial highlights might appear in their annual report:
Financial Highlights | Year 1 | Year 0 | % Change |
Total Revenues ($M) | 6,112 | 5,862 | 4.3% |
Operating Profit ($M) | 936 | 942 | -0.6% |
Earnings per Share | $8.42 | $8.65 | -2.7% |
Operating Cash Flow ($M) | 788 | 983 | -19.8% |
Free Cash Flow ($M) | 657 | 772 | -14.9% |
Free Cash Flow per Share | $8.17 | $9.65 | -15.3% |
Return on Invested Capital | 9.1% | 9.1% | 0.0% |
Dividends per Share | $4.50 | $4.20 | 7.1% |
Total Assets ($M) | 13,151 | 12,547 | 4.8% |


