Top 10 Employee Turnover Statistics for 2026
The monthly average turnover rate in the US is 3.6%.
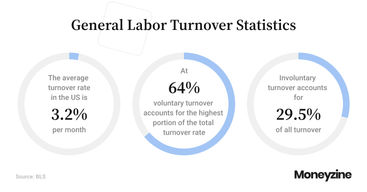
At 64%, voluntary turnover accounts for the highest portion of the total turnover rate.
Private establishments with 250-999 employees have the highest employee turnover rate of 4.7%.
At a rate of 1.6%, employee turnover is lowest in private companies with 5,000 or more employees.
The average employee turnover by industry stands at 4% in the private and 1.6% in the government sector.
At 7%, employee turnover is highest in Alaska.
US businesses lose as much as $1 trillion a year due to voluntary turnover.
The cost of replacing an employee typically ranges from one to two or more times their annual salary, depending on their position.
52% of employees quitting their jobs say their managers could have done something to prevent them from leaving.
18.7% of employees who quit their jobs do so due to career-related reasons.
General Labor Turnover Statistics

The average turnover rate in the US is 3.6% per month.
The above figure is as of August 2023 and refers to 5.7 million workers who left their jobs due to a variety of reasons in the US.
Data on year-over-year changes points to a 12% decrease in employee turnover recorded in 2022.
At 64%, voluntary turnover accounts for the highest portion of the total turnover rate.
With as many as 3.6 million US workers quitting their jobs in August 2023 alone (or a 2.3% monthly rate), voluntary turnover is a solid indication of workers’ willingness and ability to leave their employers.
Still, voluntary employee turnover rate statistics point to a decrease of nearly 18% since last year.
Involuntary turnover accounts for 29.5% of all turnover.
In August 2023, a total of 1.7 million US workers (or a 1.1% monthly rate) had to leave their jobs on account of their employers’ initiation, in the form of layoffs and discharges.
Involuntary turnover rates have remained unchanged since the year before.
Employee turnover due to other reasons accounts for 6.2% of the total turnover rate.
Besides quits, layoffs, and discharges, other reasons for employee turnover include retirement, death, disability, or transfers to other locations of the same company.
Statistics on employee turnover reveal there were 357,000 such cases (or a monthly rate of 1.1%) of turnover in the US in August 2023, while the rate remained unchanged since the year before.
Private establishments with 250-999 employees have the highest employee turnover rate of 4.7%.
Voluntary turnover is highest (3%) among companies with 50-249 employees, while layoffs and discharges are highest among companies with 250-999 and 1,000-4,999 employees (1.8% each). Turnover due to other reasons is highest 0.4%) among companies with 1-9 employees.
At a rate of 1.6%, employee turnover is lowest in private companies with 5,000 or more employees.
Establishments of this size also see the lowest number of quits (1%) as well as involuntary turnover (0.4%).
Labor Turnover Rates by Industry
*Monthly data as of August 2023
Industry | Total Turnover Rate | YoY Change | Voluntary Turnover | Involuntary Turnover | Other Turnover |
Nationwide | 3.6% | -12.19% | 2.3% | 1.1% | 0.2% |
Private Sector | 4% | -11.11% | 2.6% | 1.2% | 0.2% |
Mining and logging | 4.3% | 30.30% | 2.6% | 1.5% | 0.2% |
Construction | 4.2% | -14.28% | 2.1% | 2% | 0.1% |
Manufacturing | 3% | -11.76% | 1.8% | 1.1% | 0.2% |
- Durable goods | 2.4% | -20% | 1.3% | 1% | 0.1% |
- Nondurable goods | 4.1% | 0% | 2.6% | 1.3% | 0.2% |
Trade, transportation, and utilities | 3.9% | -13.33% | 2.7% | 1% | 0.2% |
- Wholesale trade | 2.3% | -14.81% | 1.7% | 0.4% | 0.2% |
- Retail trade | 4.3% | -15.68% | 3.1% | 1% | 0.2% |
-Transportation, warehousing, and utilities | 4.6% | -4.16% | 2.7% | 1.6% | 0.3% |
Information | 2.3% | -39.47% | 0.9% | 0.9% | 0.6% |
Financial activities | 2.3% | -11.53% | 1.5% | 0.6% | 0.1% |
- Finance and insurance | 2% | -9.09% | 1.4% | 0.5% | 0.1% |
- Real estate and rental and leasing | 3.2% | -13.51% | 1.9% | 0.9% | 0.3% |
Professional and business services | 4.9% | -5.76% | 2.6% | 1.9% | 0.4% |
Education and health services | 2.9% | -6.45% | 1.9% | 0.8% | 0.2% |
- Educational services | 2.3% | 4.54% | 1.3% | 0.9% | 0.1% |
- Healthcare and social assistance | 3% | -9.09% | 2.1% | 0.8% | 0.2% |
Leisure and hospitality | 6.5% | -10.95% | 5% | 1.4% | 0.1% |
- Arts, entertainment, and recreation | 6.7% | -2.89% | 4.3% | 2.2% | 0.2% |
- Accommodation and food services | 6.4% | -13.51% | 5.1% | 1.2% | 0.1% |
Other services | 3.4% | -20.93% | 2.3% | 0.8% | 0.3% |
Government | 1.6% | -5.88% | 1% | 0.4% | 0.2% |
- Federal | 1.1% | -21.42% | 0.5% | 0.2% | 0.4% |
- State and local | 1.6% | -11.11% | 1% | 0.4% | 0.2% |
-- State and local education | 1.7% | 0% | 1% | 0.5% | 0.2% |
-- State and local, excluding education | 1.5% | -21.05% | 1.1% | 0.3% | 0.2% |
The average turnover rate by industry stands at 4% in the private sector and 1.6% in the government sector.

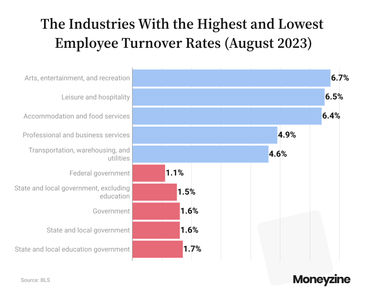
The industries with the highest employee turnover rates as of August 2023 include:
Arts, entertainment, and recreation – 6.7%
Leisure and hospitality – 6.5%
Accommodation and food services – 6.4%
Professional and business services – 4.9%
Transportation, warehousing, and utilities – 4.6%
The sectors with the lowest employee turnover rates as of August 2023 include:
Federal government – 1.1%
State and local government, excluding education – 1.5%
Government – 1.6%
State and local government – 1.6%
State and local education government – 1.7%
Voluntary turnover in the private vs the government sector stands at 2.6% and 1%, respectively.
Labor turnover statistics reveal that, at 5.1%, the food and accommodation service industry is the one that saw the highest turnover rate due to quitting this year, followed by leisure and hospitality (5%) and arts, entertainment, and recreation (4.3%).
On the other side of the spectrum, quit rates are lowest in the federal government, with 0.5%, followed by the information industry (0.9%).
Involuntary turnover averages 1.3% in the private and 0.4% in the government sector.
This year, layoffs and discharges were highest in the arts, entertainment, and recreation sector (2.2%) and the construction industry (2%).
According to employee turnover statistics, they are least common in the federal government (0.2%) and the retail trade industry (0.4%).
At 0.2%, turnover due to other reasons is equal between the private and government sectors.
Turnover due to retirement, death, disability, or transfers to other locations of the same company was highest in the information industry (0.6%), professional and business services, and federal government (0.4% each).
At a rate of 0.1%, it was least common in construction, durable goods manufacturing, finance and insurance, educational, and accommodation and food services.
Employee Turnover Data by State
*Monthly data as of August 2023
State | Total Turnover Rate | YoY Change | Voluntary Turnover | Involuntary Turnover |
Nationwide | 3.6% | -12.19% | 2.3% | 1.1% |
Alabama | 4.5% | -11.76% | 3.2% | 1.1% |
Alaska | 7.0% | -25.53% | 4% | 2.4% |
Arizona | 3.8% | -17.39% | 2.6% | 1% |
Arkansas | 4.1% | -8.88% | 2.8% | 1% |
California | 2.6% | -29.72% | 1.5% | 0.9% |
Colorado | 3.9% | -2.5% | 2.8% | 0.9% |
Connecticut | 2.8% | -15.15% | 1.4% | 1.2% |
Delaware | 4.6% | 0% | 3.1% | 1.2% |
District of Columbia | 3.1% | -6.06% | 2.1% | 0.8% |
Florida | 3.4% | -26.08% | 2.2% | 0.8% |
Georgia | 4.3% | -25.86% | 2.8% | 1.2% |
Hawaii | 3.3% | -13.15% | 2.1% | 0.9% |
Idaho | 4.7% | -11.32% | 3% | 1.3% |
Illinois | 4.1% | 24.24% | 2.3% | 1.6% |
Indiana | 4% | -9.09% | 2.8% | 1.1% |
Iowa | 4.3% | 4.87% | 2.8% | 1.3% |
Kansas | 4% | 8.10% | 2.6% | 1.2% |
Kentucky | 4.2% | -12.49% | 3% | 1% |
Louisiana | 5% | 6.38% | 3.6% | 1.2% |
Maine | 2.9% | -25.64% | 1.5% | 1.1% |
Maryland | 4% | -4.76% | 2.6% | 1.1% |
Massachusetts | 1.9% | -40.62% | 1.2% | 0.5% |
Michigan | 3.6% | 16.12% | 2.1% | 1.2% |
Minnesota | 4.3% | 16.21% | 2.3% | 1.9% |
Mississippi | 4.5% | -19.64% | 3.2% | 1.1% |
Missouri | 3.9% | 0% | 2.6% | 1% |
Montana | 5.2% | -13.33% | 3.3% | 1.5% |
Nebraska | 4.5% | 24.99% | 2.9% | 1.3% |
Nevada | 4% | -11.11% | 2.6% | 1.1% |
New Hampshire | 3.3% | -31.25% | 1.7% | 1.3% |
New Jersey | 2.8% | -22.22% | 1.6% | 0.8% |
New Mexico | 3.8% | -9.52% | 2.4% | 1% |
New York | 2.7% | -6.89% | 1.2% | 1.3% |
North Carolina | 4.4% | 2.32% | 2.9% | 1.3% |
North Dakota | 5% | 19.04% | 3.2% | 1.6% |
Ohio | 3.8% | -7.31% | 2.6% | 1.1% |
Oklahoma | 4.1% | -12.76% | 2.7% | 1.2% |
Oregon | 3.8% | -20.83% | 2.3% | 1.2% |
Pennsylvania | 2.8% | -22.22% | 1.8% | 0.8% |
Rhode Island | 3.4% | -19.04% | 1.8% | 1.4% |
South Carolina | 4.6% | -2.12% | 3.3% | 1.1% |
South Dakota | 4.5% | 28.57% | 2.8% | 1.5% |
Tennessee | 4.2% | -15.99% | 3% | 1% |
Texas | 4% | -11.11% | 2.9% | 0.9% |
Utah | 4.5% | -4.25% | 2.9% | 1.2% |
Vermont | 3.6% | -16.27% | 2.3% | 1% |
Virginia | 3.9% | 5.4% | 2.7% | 1% |
Washington | 3.6% | 9.09% | 2.1% | 1.1% |
West Virginia | 5% | 2.04% | 3.4% | 1.3% |
Wisconsin | 4% | 5.26% | 2.4% | 1.3% |
Wyoming | 5.5% | -21.42% | 3.4% | 1.4% |
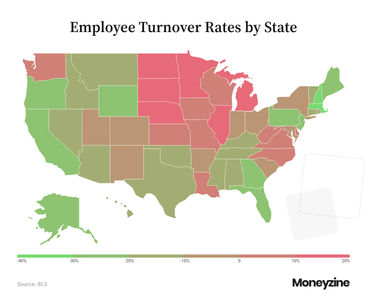
At 7%, employee turnover is highest in Alaska.
As of August 2023, the US states with the highest employee turnover rates include:
Alaska – 7%
Wyoming – 5.5%
Montana – 5.2%
Louisiana – 5%
North Dakota – 5%
West Virginia – 5%
At 4%, Alaska is also the state with the highest voluntary turnover rate, followed by Louisiana (3.6%), Wyoming and West Virginia (3.4% each), Montana and South Carolina (3.3% each).
The involuntary turnover rate is also highest in Alaska, with 2.4%, followed by Minnesota (1.9%), Illinois and North Dakota (1.6% each), and Montana and South Dakota (1.5% each).
Employee turnover is lowest in Massachusetts, at 1.9%.
The US states with the lowest employee turnover rates as of August 2023 include:
Massachusetts – 1.9%
California – 2.6%
New York – 2.7%
Connecticut – 2.8%
New Jersey – 2.8%
Pennsylvania – 2.8%
At 1.2%, the lowest voluntary turnover rates are in Massachusetts and New York, followed by Connecticut (1.4%), California and Maine (1.5% each), New Jersey (1.6%) and New Hampshire (1.7% each).
Massachusetts also has the lowest involuntary turnover rate, with 0.5%, followed by DC, Florida, New Jersey, and Pennsylvania (0.8%), California, Colorado, Hawaii, and Texas (0.9% each).
At 4.1%, the employee turnover rate is highest in states of the South.
The Midwest follows closely with 4%, while turnover rates in the West and Northeast are 3.3% and 2.7%, respectively.

Employee Turnover Costs Statistics
US businesses lose as much as $1 trillion a year due to voluntary turnover.
Some reports estimate that replacing a salaried employee costs six to nine months' worth of their salary in recruiting and training expenses.
The cost of replacing an employee typically ranges from one to two or more times their annual salary, depending on their position.
For instance, hourly employees have been known to cost organizations $1,500 to replace.
However, data on staff turnover rates reveals that replacing an employee in a technical position can cost as much as 100%-150% of their annual salary, and costs increase up to 213% for C-suite staff.
Data on Turnover Reasons
52% of employees quitting their jobs say their managers could have done something to prevent them from leaving.
A close 51% say that none of the management or leadership staff has spoken with them about job satisfaction or their future at the organization in the three months prior to them leaving.
Companies that provide regular employee feedback have recorded 14.9% lower turnover rates.
What’s more, organizations with formal employee recognition programs record 31% lower voluntary staff turnover rates and are 12 times more likely to achieve strong business outcomes.
79% of US workers believe empathetic leadership can decrease employee turnover.
Respective 54% and 49% of workers have left a job due to management’s lack of empathy regarding their professional or personal struggles.
A toxic culture is 10.4 more likely to contribute to employee turnover than compensation.
Relative to compensation, job insecurity and high levels of innovation are 3.5 and 3.2 times more likely to contribute to turnover. Failure to recognize employee performance is 2.9 times as important as compensation when it comes to labor turnover rates.
18.7% of employees who quit their jobs do so due to career-related reasons.
Such reasons include growth and/or promotion opportunities, achievements, security, or education.
Job-related reasons, such as stress, resource and training availability, job characteristics, empowerment, etc., are the second most common, as cited by 12.4% of employees who voluntarily leave their jobs.
Rewards (like base pay, benefits, bonuses, or commissions) and health and family reasons (such as child or elder care, work or non-work-related health concerns) follow, with 11.9% and 11.3%, respectively.
Cited by 10.8%, work-life balance rounds the list of the top five reasons why employees quit their jobs.
Per employee turnover data, other reasons include:
Relocation (employee, company initiated, or spouse initiated) – 8.8%
Management (their professional behavior, support, knowledge and skills, or communication) – 7.9%
Environment (the organization’s culture, facilities, mission and values, safety, diversity, or coworkers) – 7.8%
Retirement – 5.7%
Termination or layoff – 4%
.png)


