This retirement withdrawal rate calculator requires the user to supply only two inputs: a retirement portfolio mix and the desired payout period. Using this information, the calculator provides the likelihood the portfolio will successfully support withdrawal rates ranging from 3 to 8%.

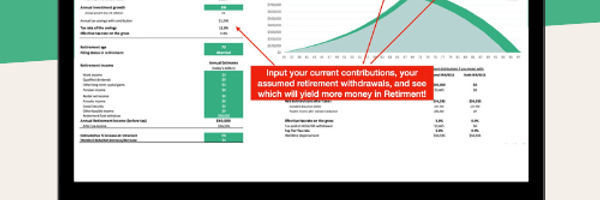
Roth IRA or 401k? This template will answer your questions.
With this template, you will get:
All DFY, simply add your details
Charts for comparison and clear answer
Easily update for any year (2023, 2024, 2025, etc…)

Calculator Definitions
The variables used in our online calculator are defined in detail below, including how to interpret the results.
Portfolio Mix (% Stocks, % Bonds)
Additional Resources |
Retirement Fund Growth Calculator Retirement Income Calculator Retirement Withdrawal Calculator Retirement Savings Calculator Millionaire Calculator |
This tool allows the user to select from five different retirement portfolio mixes, ranging from 100% Stocks to 100% Bonds.
Desired Payout Period (Years)
In this section of the calculator, the user selects from four different payout periods. This represents the number of years the retiree would like for their portfolio to last at a given withdrawal rate. For example, if a 65 year old would like their retirement portfolio to last until age 95, then the Desired Payout Period is 30 Years.
Inflation
The calculator provides two sets of Success Rates: With and Without Inflation. The measure of inflation used to produce these results is the Consumer Price Index for urban consumers (CPI-U). The adjustment for inflation allows retirees to retain their overall purchasing power, by increasing the Withdrawal Rate annually. For example, a 5.0% Withdrawal Rate plus a 2.0% rate of inflation allows the retiree to withdraw 5.0% in the first year, then 5% x 1.02 = 5.1% in year 2, then 5.1% x 1.02 = 5.3% in year three and so on.
Success Rate (%)
The Success Rate is defined as the ability of a portfolio to last longer than the Desired Payout Period at a given Withdrawal Rate. For example, a Success Rate of 100% means there is a 100% chance the portfolio will last longer than the Desired Payout Period. While some users will be willing to accept greater risks of failure than others, acceptable withdrawal rates should exhibit a Success Rates of 75% or better. The calculated Success Rates are based on the 2011 landmark study: Portfolio Success Rates: Where to Draw the Line, by Philip L. Cooley, Ph.D.; Carl M. Hubbard, Ph.D.; and Daniel T. Walz, Ph.D. The information used in this study included 84 years of historical returns for 15, 20, 25, and 30 year timelines from 1926 through 2009.
Withdrawal Rates
This calculator allows the user to quickly compare a variety of Success Rates at Withdrawal Rates that range from 3 to 8%. At withdrawal rates below 3%, a 100% Success Rate is assured at all Payout Periods and all Portfolio Mixes. At Withdrawal Rates in excess of 8%, none of the With Inflation scenarios produces acceptable results.
Example Scenario
A retiree with a $1 million investment portfolio consisting of 50% stocks and 50% bonds would like to find a non-inflation adjusted withdrawal rate that provides a calculated Success Rate of 90% or better with a Payout Period of 25 Years. In this example the retiree finds they can withdraw up to 7% of their portfolio each year with a 95% Success Rate. Therefore, the investor can withdraw $1 million x 7% or $70,000 from their portfolio each year.
Withdrawal Rate Calculator
Disclaimer: These online calculators are made available and meant to be used as a screening tool for the investor. The accuracy of these calculations is not guaranteed nor is its applicability to your individual circumstances. You should always obtain personal advice from qualified professionals.


.jpg)
.jpg)